Factor Graphs for Relational Regression
Mentors: Prof. Yann LeCun, Prof. Andrew Caplin, and Prof. John LeahyCollaborator: Trivikraman Thampy
Factor Graphs for Relational Regression
Technical Report: TR2007-906, January 2007Traditionally, most supervised learning algorithms assume that the data is independently and identically sampled from a fixed underlying distribution. These methods process each sample independently of others while making a decision. However there are a number of real world problems in which the data possess an inherent relational structure. The value of the unknown variables (those that are to be predicted) associated with a sample not only depends on its individual set of features, but it also depends on the features and the values of unknown variables associated with other samples that are related to it. Furthermore, these dependencies need not be direct. The samples could influence each other via a set of hidden (latent) variables.
Thus while making a prediction
on a particular sample, one can gain significant
performance improvement if these interaction between
samples are exploited. Moreover, in many situations the
latent variables associated with the problem have some
underlying structure associated with them. This structure
can also be used while handling the latent variables during
the process of inference and training.
We are working towards designing a framework for doing
regression in such relational settings, where the variables
(including the latent variables) take on continuous values.
In particular we propose a relational factor graph
architecture that allows for efficient inference and
training in relational regression problems. In addition to
being capable of handling continuous variables, the
proposed framework also allows for the use of
log-likelihood functions that are non-linear in the
parameters (that is, the non-exponential family of
functions), and also eliminates the intractable partition
function problem through the use of clever design of the
factors.
Relational Factor Graphs for the Problem of House Price Prediction
Mentors: Prof. Yann LeCun, Prof. Andrew Caplin, and Prof. John LeahyCollaborator: Trivikraman Thampy
Discovering the Hidden Structure of House Prices with a Non-Parametric Latent Manifold Model
13th International Conference on Knowledge Discovery and Data Mining (KDD), San Jose CA, August 2007The problem of real estate price prediction is one such problem that falls in the domain of relational regression. The price of a house obviously depends on its individual characteristics: a 3 bedroom house will generally be more expensive than a 1 bedroom house. However, in addition to this dependence, the price also depends on the "desirability" of the neighborhood in which it lies: given two houses of similar characteristics, the one that is located in an up-market locality will be more expensive than the one which is located in a poor locality. Some of the neighborhood features that contribute to its "desirability" are measurable, such as the quality of the local schools, median house hold income etc. However a number of features that make one particular neighborhood highly "desirable" than others, cannot be measured directly and are merely reflected in the prices of other houses in the vicinity.
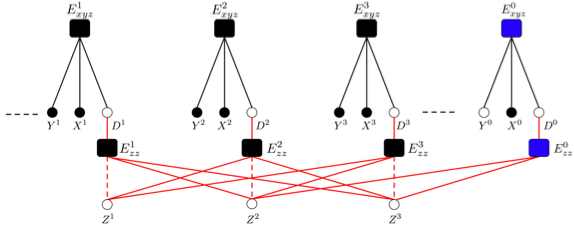
We apply the above relational factor graph framework to this problem. The idea is to use a single factor graph for the entire collection of samples (houses). Each sample is associated with two factors. The first factor is parametric in nature that captures the dependencies between the individual sample characteristics and its price. The second factor is non-parametric and captures the dependencies between the samples via latent variables. These latent variables can be interpreted as the "desirability" of the location of sample (a house) which needs to be learnt. We propose an efficient inference and training algorithm to train this huge factor graph.
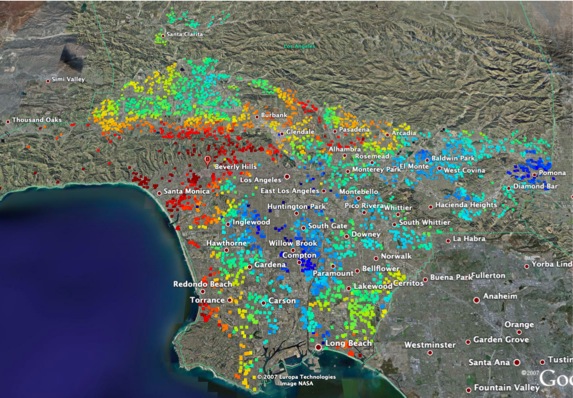
The plot shows the learnt
"desirability" map by our algorithm for the city of Los
Angeles. Each colored point correspond to a test sample (a
house), and is colored according to the value of the
"desirability" of its location. Red color means high
desirability and blue color means low. It is interesting to
see that the algorithm is doing something very meaningful
here. Areas like Pasadena, along the coast line (in
particular around Santa Monica), parts of Hollywood hills
among others are labeled as desirable. Whereas, areas in
the vicinity of the downtown, in particular the eastern and
south eastern region are classified as less desirable.
Conditions on Loss Functions for Training Energy-Based Models
Mentors: Prof. Yann LeCunCollaborator: Raia Hadsell, Marc'Aurelio Ranzato, Jie Huangfu
A Tutorial on Energy-Based Learning
Predicting Structured Outputs, Bakir et al. (eds), MIT Press 2006.Probabilistic models associate a probability to each configuration of relevant variables. In contrast, Energy Based Models (EBMs) associate an energy to each configuration of the relevant variables, without the need for proper normalization of these energies. Inference in an EBM consists of choosing the configuration with the lowest energy. Training of such a system must be done in a way so that it assigns low energies to configurations of variables consistent with the training samples, and high energies to others. This task can be accomplished by minimizing a suitably designed loss functional, which is a function of energy functions of all the training samples.
A wide variety of loss functionals can be used for this purpose. However not all the loss functionals train all the architectures successfully. One important question is, what properties should a loss function possess so that its minimization will lead the system to achieve the
behavior mentioned above? And how to design it?
We are working on studying the
properties of various loss functionals used in energy based
models and give sufficient conditions that any loss
functional should satisfy, such that its minimization will
successfully train the machine, in supervised learning
framework. In addition we are working in the direction of
designing an alternate EM type (deterministic EM) learning
algorithm, for energy based systems involving latent
variables that will work for general forms of loss
functions.
Learning a Similarity Measure Discriminatively Using a Siamese Network
Mentor: Prof. Yann LeCunCollaborator: Raia Hadsell
Learning a Similarity Measure Discriminatively with Applications to Face Verification
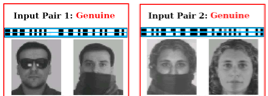
IEEE Conference on Computer Vision and Pattern Recognition (CVPR), San Diego CA, June 2005.For the problem of classification, traditional discriminative approaches, such as neural networks or svm's, require that all categories be known in advance. In addition these approaches also require that the training samples be available for all categories and they only work for small number of classes. A common approach to such kind of problems are distance based methods. This involves computing a similarity metric between the pattern to be classified/verified an a library of stored prototypes.
We designed a new scheme for
discriminatively learning a similarity metric from data.
The idea is to learn a function that maps input patterns to
a target space such that the L1 norm in the target space
approximates the semantic distance in the input space. The
method was realized using a network architecture called a
Siamese
Network. This method can be used in
recognition/verification tasks where the number of
categories is large and not known in advance and where the
number of training samples per category is small. The
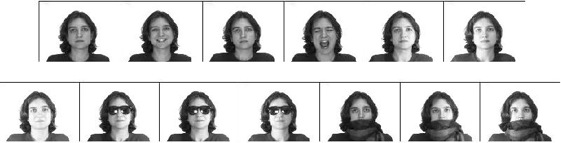
method was applied to the problem of face verification
using a number of standard datasets, which included the
AT&T dataset, FERET dataset and AR-Purdue dataset.
Other than this we also applied this scheme for invariant
object recognition and tested it on general categories
(using Caltech 101 dataset), handwritten digits (using
MNIST), and cluttered 3d objects (NORB).
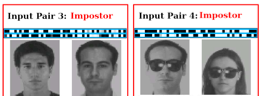
A Siamese Network
is composed of a number of components. This includes two
identical copies of a parameterized function sharing the
same parameters and a cost module. A loss function is
plugged on top of it. The whole architecture takes a pair
of objects (images for example) as input, which is passed
to the two copies of the function. The cost module on top
generates an energy between the outputs of the two
functions. The loss function then combines the energy with
the desired output label (which is also supplied to the
architecture during training) to produce a scalar loss. The
parameters of the functions can be updated using stochastic
gradient.
Dimenionality Reduction by Learning an Invariant Mapping
Mentor: Prof. Yann LeCunCollaborator: Raia Hadsell
Dimensionality Reduction by Learning an Invariant Mapping
IEEE Conference on Computer Vision and Pattern Recognition (CVPR), New York City, NY, June 2006Massive high dimensional datasets generated by a number of disciplines demand new techniques for its analysis, feature extraction, dimensionality reduction. Dimensionality reduction involves mapping a set of high dimensional input points onto a low dimensional manifold so that "similar" points in the input space are mapped to nearby points in the output manifold. There exists a number of standard techniques for solving this problem, like Principal Component Analysis (PCA), Multi-Dimensional Scaling (MDS), Local Linear Embedding (LLE), ISOMAP, Laplacian Eigen Maps, Hessian LLE and others. However most of these techniques suffer from two major drawbacks. One, they depend on a meaningful and computable distance measure in the input space. Two, none of the above techniques compute a "function" that could faithfully map a new input sample whose relationship with the training data is not known.
We proposed a new scheme for
dimensionality reduction - called Dimensionality Reduction
by Learning an Invariant Mapping (DRLIM) - that
addresses the above two issues. It learns a globally
coherent non-linear function that maps the data evenly on
the output manifold. The learning relies solely on the
neighbourhood relationships and does not require any
computable distance measure in the input space. These
neighbourhood relationships can come either as prior
knowledge or manual labeling. The method can learn mappings
that are invariant to a number of transformations of the
input.
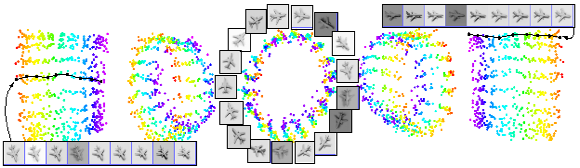
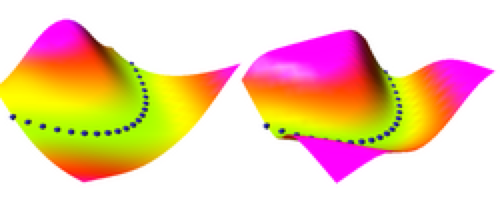
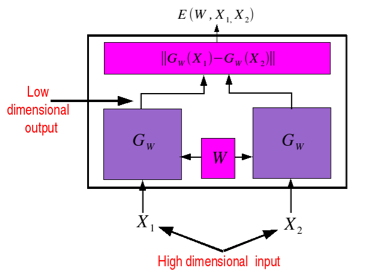
The top picture shows the
output when DRLIM is applied to two digits from the MNIST
dataset that were artificially distorted to have geometric
distortions (in particular translations). Note how a pair
of digits which are identical in shape but differ only in
translation lie close to each other. The bottom picture
shows the output when DRLIM is applied to images of a
single plane from the NORB dataset. Neighbourhoods were
defined independent of the lighting conditions. As expected
the planes are neatly arranged according to the
neighbourhood relationships parameter (which were azimuth
and elevation angles), and the arrangement is independent
of lighting.
Learning Applied to Ground Robots
Mentor: Prof. Yann LeCunCollaborator: Raia Hadsell, Matthew Koichi Grimes, Ayse Naz, Marc'Aurelio Ranzato
On-line Learning for Offroad Robots: Using Spatial Label Propagation to Learn Long-Range Traversability
R. Hadsell, P. Sermanet, J. Ben, A. Erkan, J. Han, M. Grimes, S. Chopra, Y. Sulsky, B. Flepp, U. Muller, and Y. LeCunTechnical Report, CBLL-TR-2007-01-01, January 2007
NYU team - headed by Prof. Yann LeCun in collaboration with Net-Scale Technologies - was selected for the LAGR (Learning Applied to Ground Robots) projects funded by DARPA. The goal is to design a robust autonomous navigational system given fixed hardware. The robot is provided by DARPA, and the challenge lies in designing the navigational system complying with the limited capabilities of the hardware.
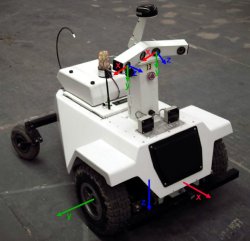
I was partly involved in
designing the long range obstacle detection system. However
due to political and competitive reasons I cannot disclose
further details of the system, until it is actually tested
and deployed on the field!!! Other than that, I also
designed a short range obstacle detection system using
Homography transformation.