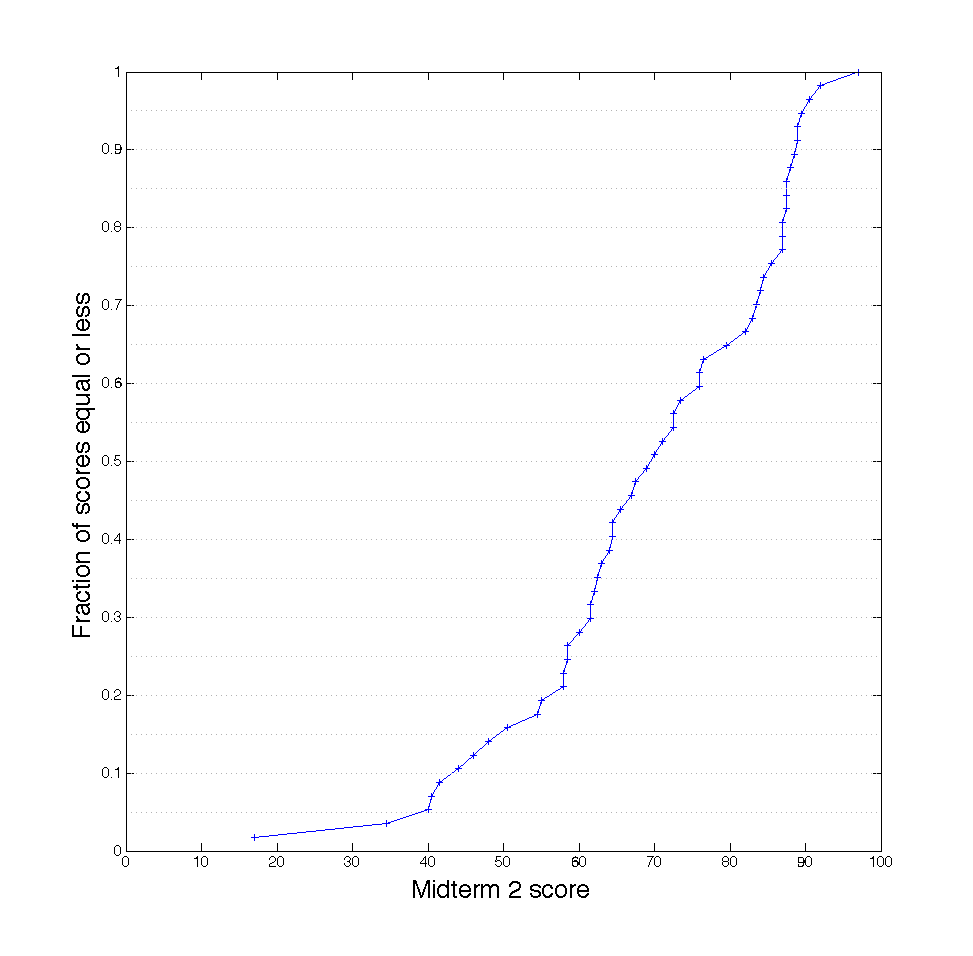
Below are the class's exam scores on Midterm 2, depicted as a cumulative distribution function (or CDF). As stated in the context of the last exam's distribution, CDFs contain a lot of information (all of the information about a distribution in fact), but they take practice to learn to read. Below, we review this.
A CDF, by definition, maps a given x value (in this case a score) to a fraction. That fraction represents the fraction of scores in the distribution that are lower than the given x value. For example, x=80 (approximately) maps to y=.65, so if you got a 80/100, then you scored equal to or higher than 65% of the class.
In other words, this graph maps scores to percentiles.
This kind of graph also allows you map from percentiles back to scores. For example, to ask about the median, or 50th percentile, start at y=.5, and look at the x value for which the curve crosses the line y=.5 (it is x=70). Using the same technique, you can ask about the 75th percentile (top quarter), the 25th percentile (bottom quarter), etc. Simply start with a particular y-value, and look for the corresponding x-value.