Spotted Cats
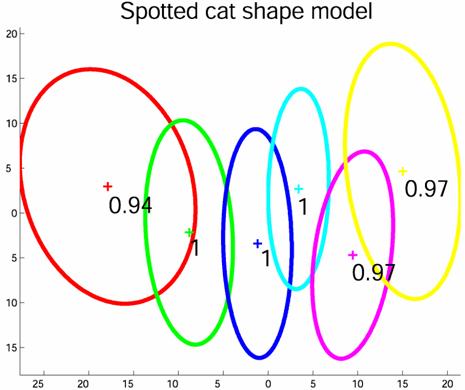
On the left we show the shape model. Each part of the model is shown in a different colour. The mean location is indicated by the cross, with the ellipse showing the uncertainty in location. The number by each part is the probability of that part being present. On the right, we show examples of regions which are closest to the mean of the appearance density of each part. Here the shape model is very loose and uninformative, but the model picks up on the animals spotted fur.
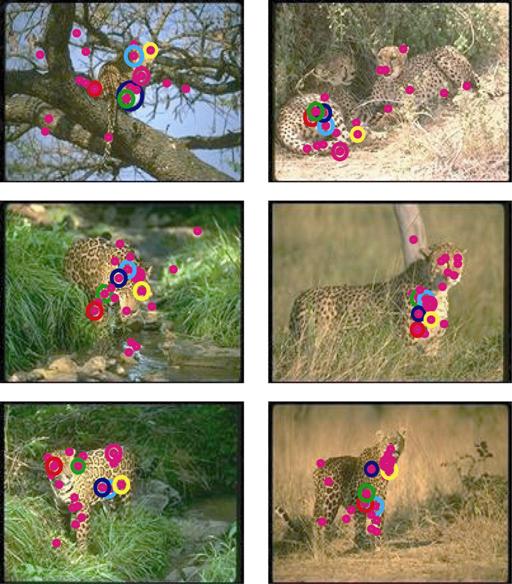
Here are some examples of the cats being found in often quite cluttered scenes. Again, the size of the circles corresponds to the size of the region.