Airplanes
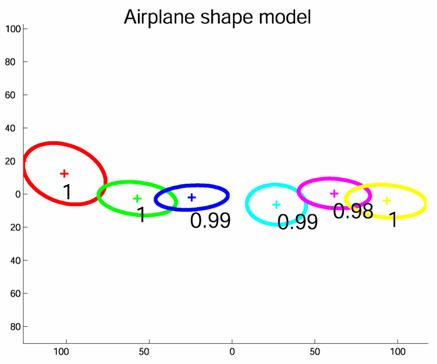
On the left we show the shape model. Each part of the model is shown in a different colour. The mean location is indicated by the cross, with the ellipse showing the uncertainty in location. The number by each part is the probability of that part being present. On the right, we show examples of regions which are closest to the mean of the appearance density of each part. We can see that the linear structure of the airplane is picked out, with bits of tail, fuselage and noses present in the appearance patches of the appropriate part.
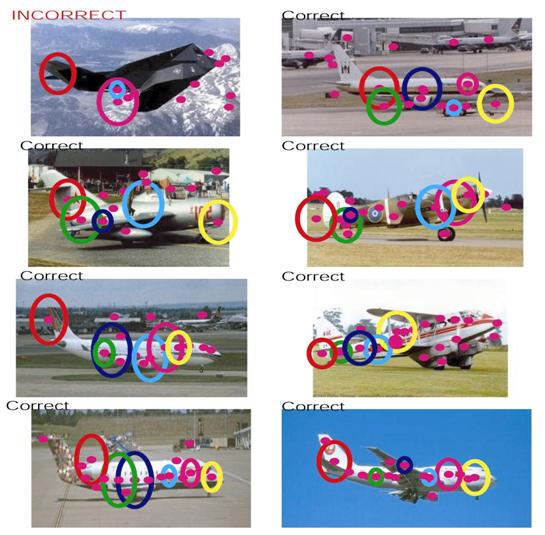
Here is the model evaluating some test images. The size of the ellipse corresponds to the size of the region. Notice it gets the stealth fighter wrong - but then it doesn't look much like other planes, so it's not that surprising.